| StockFetcher Forums · Stock Picks and Trading · Attn: FOUR | << 1 2 >>Post Follow-up |
| karennma 8,057 posts msg #126531 - Ignore karennma |
12/30/2015 8:01:53 AM Hi Four, Hope u had a nice Christmas. I was hoping you could explain this since I know you use Bollingers a lot. This is part of the "Emergency Broadcast" post (in case u need to reference the original) under this thread. I've posted part of the dialogue because I don't understand something. (specifically, "$185.72 was BB125".) Hope you can follow this ... (JP is on vacation.) Pls see below ... (see lines w/ "?") 2/28/2015 7:36:12 AM johnpaulca 9,355 posts msg #126488 - Ignore johnpaulca 12/24/2015 9:29:57 AM go long DWTI($185.72). ================= karennma Good morning JP, $185.72??? How'd you come up with that number? >>>? johnpaulca 9,357 posts msg #126504 - Ignore johnpaulca 12/28/2015 3:34:01 PM @ Karen.....$185.72 was BB125 I think. >>> ? @ Four, BB125? I don't know what he means. How do you draw that? Can you please post a DWTI chart and show price $186-187 @ BB125? Thanks a bunch. |
| Eman93 4,750 posts msg #126532 - Ignore Eman93 |
12/30/2015 9:27:50 AM K that's bollinger band 125 |
| karennma 8,057 posts msg #126533 - Ignore karennma |
12/30/2015 9:33:54 AM Do you mean the BB is set @ 125 instead of 20,2? |
| karennma 8,057 posts msg #126534 - Ignore karennma |
12/30/2015 9:35:31 AM symlist(dwti) draw Bollinger Oscillator(125) Well, that doesn't work. |
| karennma 8,057 posts msg #126535 - Ignore karennma |
12/30/2015 9:37:11 AM @ Four, BB125? I don't know what he means. How do you draw that? Can you please post a DWTI chart and show price $186-187 @ BB125? Thanks a bunch. ============= A picture is worth 1,000 words. If anyone can post a chart showing this, I'd appreciate. Thanks. |
| karennma 8,057 posts msg #126538 - Ignore karennma modified |
12/30/2015 5:36:15 PM http://schrts.co/dxnuVe <<<<< copy and open link in new window Yeah, okay. BB width = 122.74 yesterday. So? The BB width scale in that chart doesn't tell me jack ... Eventho' according to John Bollinger: "The most popular use of bandwidth is to identify the squeeze, which is a 125-period low for the indicator, and is very helpful in diagnosing the beginning of trends." Blah, blah, blah .. if interested, just google: bollinger band width 125 |
| johnpaulca 12,036 posts msg #126539 - Ignore johnpaulca |
12/30/2015 5:40:47 PM use 0.1 std |
| karennma 8,057 posts msg #126540 - Ignore karennma modified |
12/30/2015 5:53:49 PM http://schrts.co/dxnuVe <<<<< copy and open link in new window * Hi all, Sorry about the above link. I have no clue how to post a screenshot of the chart. Feel free to do so if U know how. Thx. Happy New Year everyone. C U next week. *Oh! I don't even know if that link is gonna give you the chart with my settings. Anyway, scroll down, and where it says "Indicators" click the arrow and click BB Width. For parameters, enter 125,2. |
| four 5,087 posts msg #126541 - Ignore four modified |
12/31/2015 8:44:10 AM karennma, here you go... price above both BBs... 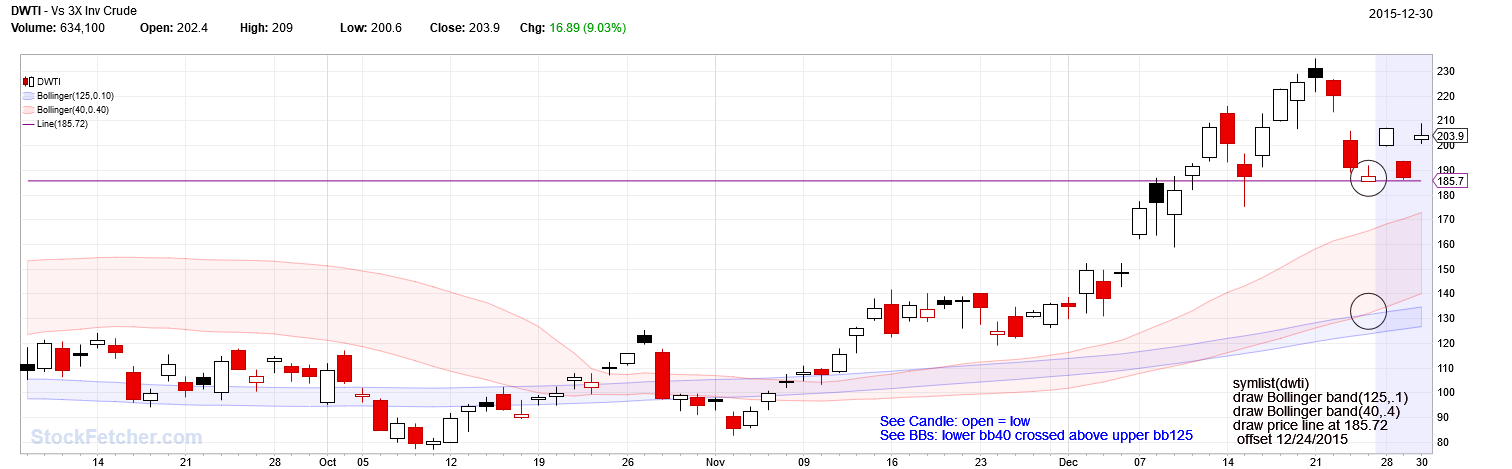 |
| four 5,087 posts msg #126661 - Ignore four modified |
1/9/2016 11:20:20 AM update ------ 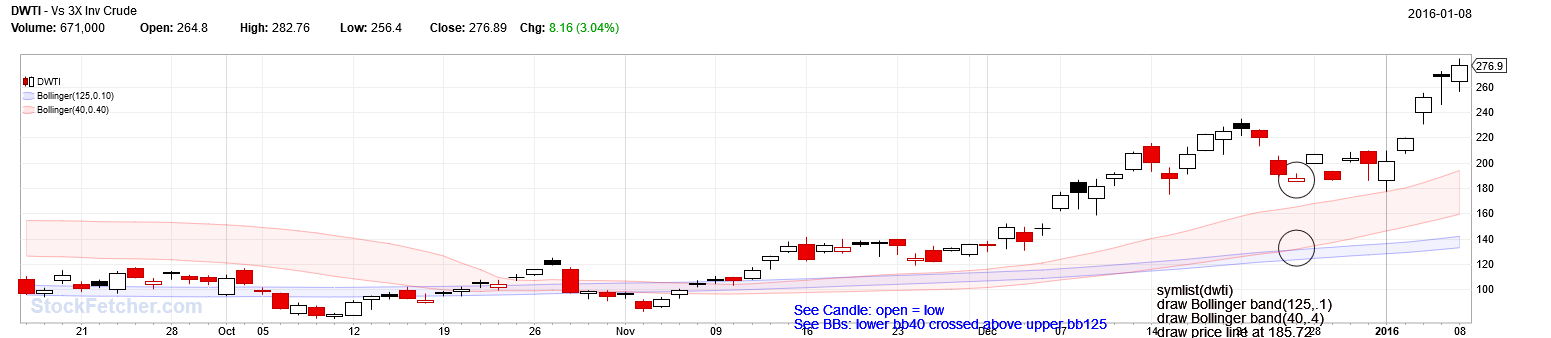 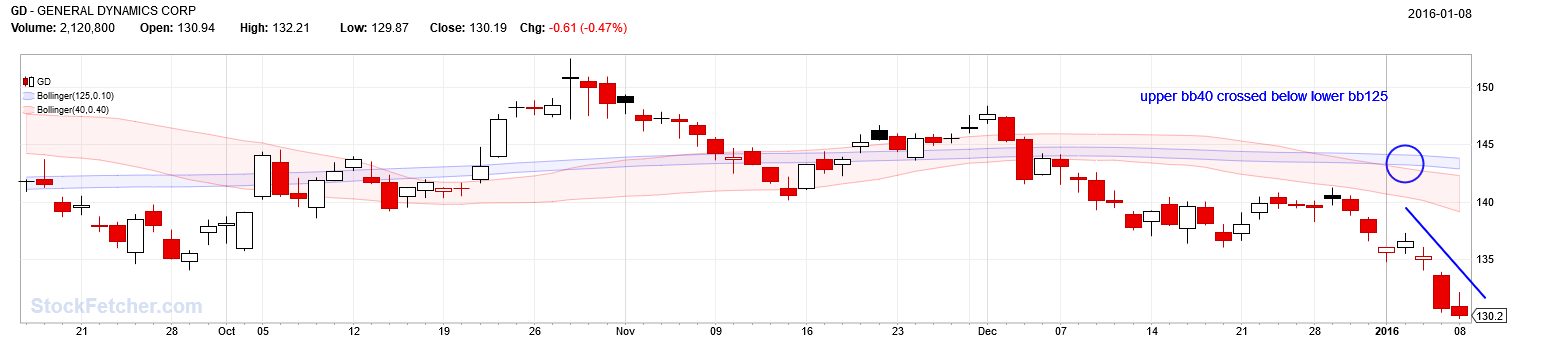 |
| StockFetcher Forums · Stock Picks and Trading · Attn: FOUR | << 1 2 >>Post Follow-up |