| StockFetcher Forums · Stock Picks and Trading · Intraday Alerts | << 1 ... 1478 1479 1480 1481 1482 ... 1903 >>Post Follow-up |
| Mactheriverrat 3,172 posts msg #127437 - Ignore Mactheriverrat modified |
2/27/2016 11:14:50 PM One thing about SPY is the MA(20) is trending up for the last 10 days.  |
| johnpaulca 12,036 posts msg #127438 - Ignore johnpaulca |
2/27/2016 11:32:00 PM SPY...failed high on my monthly Tarmac indicator since Dec 2014. Monthly trend is broken. Lets see if bulls show up on Monday and Tues...they have to or look below, will be violent swings great for day traders. |
| four 5,087 posts msg #127439 - Ignore four modified |
2/28/2016 12:54:11 AM JP. . breakout above upper band .. thoughts for a long? Still below ema100 What would you do with this ... now VERSUS years ago? dug this one up from you... close between 3 and 200 volume is above 1000000 upper bollinger band(9,0.1) is above upper bollinger band(40,0.4) for the last 1 day close is above upper bollinger band(9,0.1) close is above ema(100) 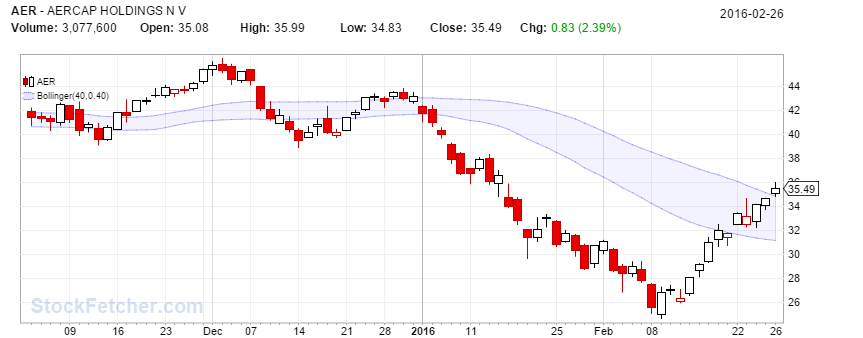 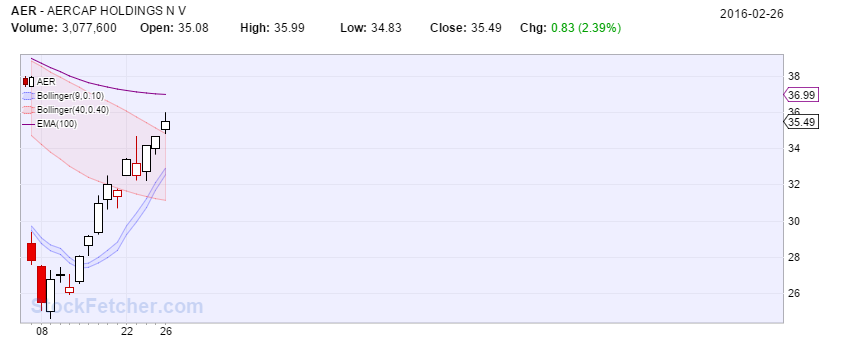 |
| Mactheriverrat 3,172 posts msg #127440 - Ignore Mactheriverrat |
2/28/2016 2:54:32 AM Yes Monthly trend is broken on SPY . I still think it can go either way. Sure wish the markets would get over the connection with the price on oil vs the markets. Hope market isn't a bloodbath monday. Feb could end with a nice bullish candle on the monthly chart. |
| johnpaulca 12,036 posts msg #127441 - Ignore johnpaulca |
2/28/2016 3:52:51 PM four 2,697 posts msg #127439 - Ignore four modified 2/28/2016 12:54:11 AM JP. . breakout above upper band .. thoughts for a long? Still below ema100 What would you do with this ... now VERSUS years ago? dug this one up from you... **************************************************************************************************** Some of my thought process Lets start with: monthly chart......down 3D chart:....down Daily....down 3-hr...oversold...long now is chasing and risky!! closed Friday ...t $35.49 Major Resistance...$35.56 daily BB40 below BB125...trend down sellers will short the bounce at next resis hope this helps. |
| four 5,087 posts msg #127442 - Ignore four |
2/28/2016 7:57:41 PM JP thanks |
| Mactheriverrat 3,172 posts msg #127445 - Ignore Mactheriverrat |
2/28/2016 8:39:15 PM AER first buy was 2/12 Nice bullish candle on 2/12, RSI(5) above RSI(5) one day ago, Price pushed above EMA(4) and even pushed the EMA(10), MACD 4,17, 10 gap from fast line and slow line expanding, and MACD 1,10,16 getting into the Bullish act. Since then its up 24.02% and not a bad run in a market that were. Could go up another day or two until it gets where the blue circle resistance area. Looks like its getting near that lower end of blue circle resistance area already. IMHO! 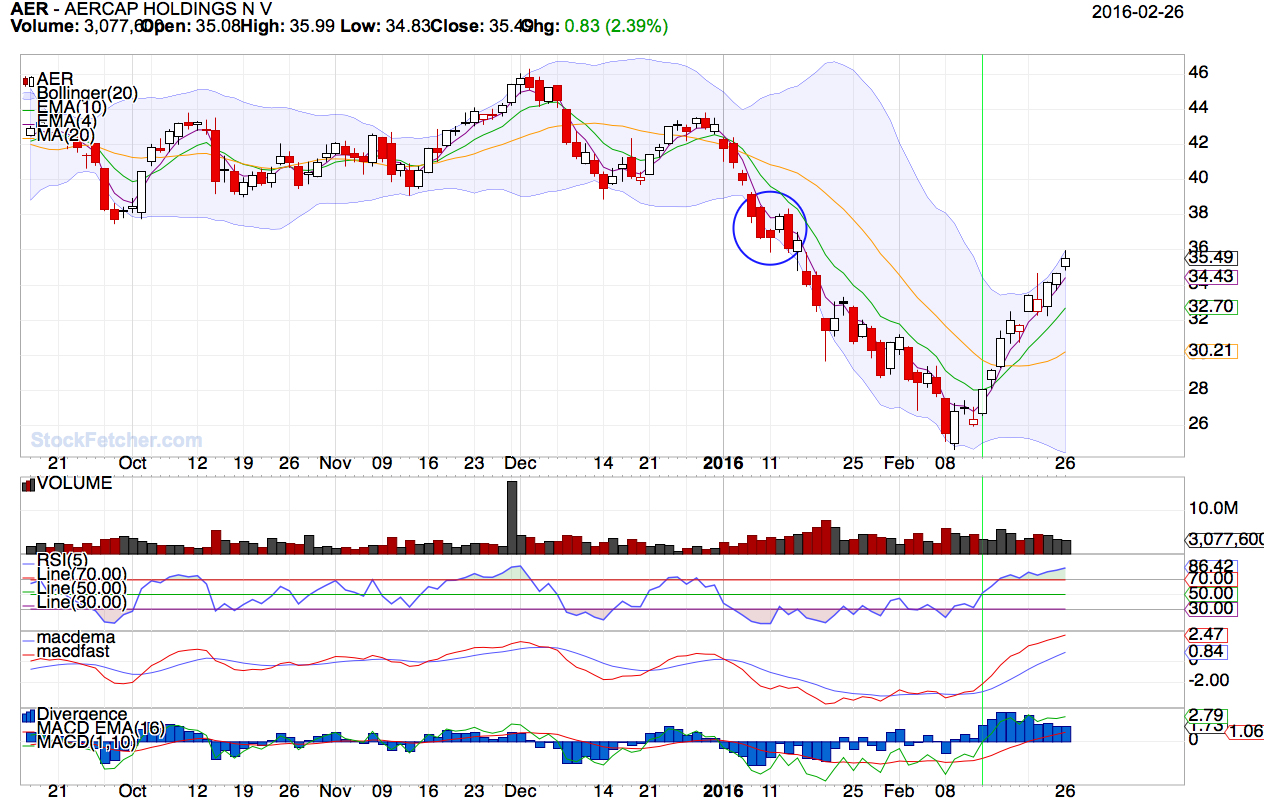 |
| four 5,087 posts msg #127446 - Ignore four |
2/28/2016 8:41:52 PM mac thanks |
| johnpaulca 12,036 posts msg #127449 - Ignore johnpaulca |
2/28/2016 11:27:02 PM johnpaulca 9,532 posts msg #127387 2/22/2016 9:13:03 AM SPY....again we will be opening at resis, roughly at 194.52. Pay attention to 196.6, this is a strong resis line to see what buyers will do. *********************************************************************************************************************************** High on Friday was 196.68 and was immediately rejected as expected, probability of higher open on Monday looks bleak. You will need some really, really good news tomorrow to get bulls buying. FYI...I'm short. |
| johnpaulca 12,036 posts msg #127451 - Ignore johnpaulca |
2/29/2016 4:50:09 PM SPY...4-million buy shares just came across the tape....wow!!! |
| StockFetcher Forums · Stock Picks and Trading · Intraday Alerts | << 1 ... 1478 1479 1480 1481 1482 ... 1903 >>Post Follow-up |