| StockFetcher Forums · Stock Picks and Trading · Intraday Alerts | << 1 ... 1511 1512 1513 1514 1515 ... 1903 >>Post Follow-up |
| four 5,087 posts msg #129261 - Ignore four |
6/20/2016 8:03:16 PM JP, please comment on these two charts (long/short/stop-loss...) 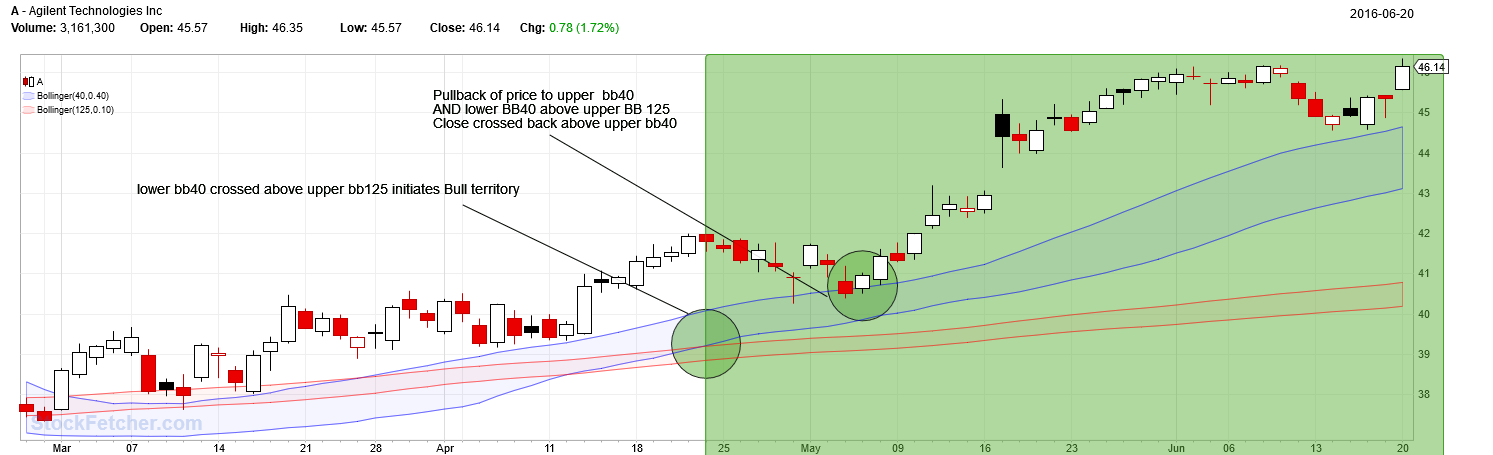 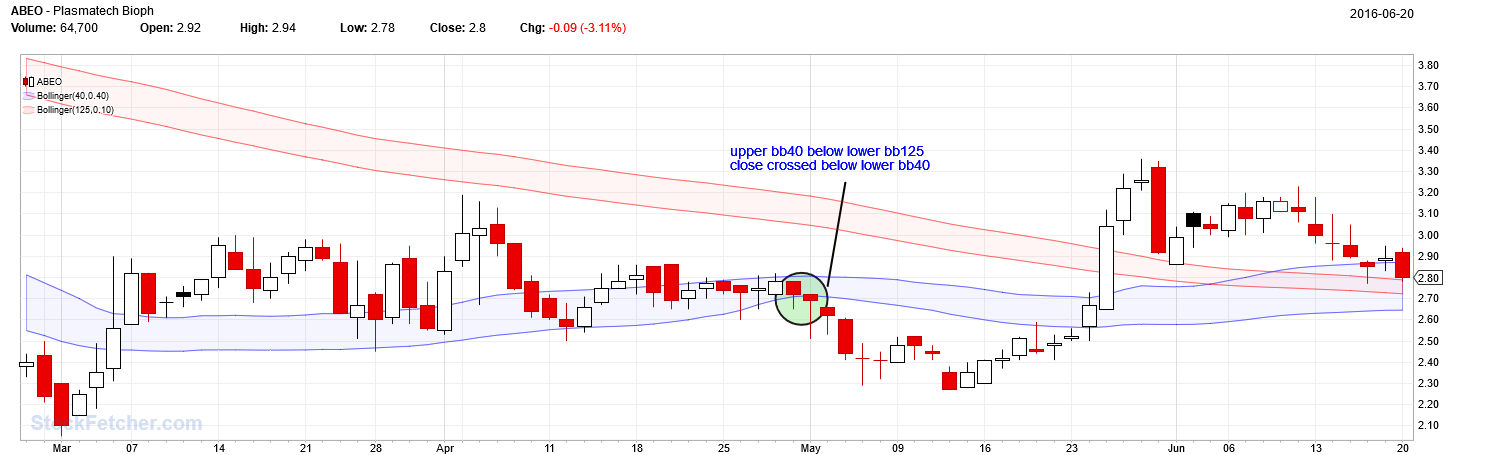 |
| pthomas215 1,251 posts msg #129262 - Ignore pthomas215 |
6/20/2016 8:10:22 PM karen, I took a stab at it because I was curious too. this one you would go long on, not short. |
| johnpaulca 12,036 posts msg #129271 - Ignore johnpaulca |
6/21/2016 9:31:10 AM @4 A....trend is up: BB40 above BB125, stock is controlled by bulls. Pullbacks should stay above upper BB125 depending on the market/news and pain. Buy signals: I look for momentum stocks, price moving from the upper BB125 then into BB40, choose stocks with strong consolidation above BB125. If using an indicator ie CCI(18) for a trigger look for common turning points for that indicator: -168(deep pullback) high probability for a mean reversion, common turning points are -99.3 and -33. Important to find support/resis areas on your chart, start with monthly and draw thick lines then daily thinner lines so you can see them quickly. Important to check for Time and Sales to check is guys are dumping or buying and how big are the blocks. important to trade in the direction of the market, you can see after first mins. On your 30-min bar draw 3-lines, top, bottom and in the middle. Price staying above the middle line signals buyer's interest, below seller's interest...not a foolproof method but a good guideline. - lots more to talk about but hope this helps a little...market is about to open (: |
| johnpaulca 12,036 posts msg #129272 - Ignore johnpaulca |
6/21/2016 9:34:30 AM SPY...BB40 crossed below BB125 yesterday ...see 3-hr chart, this is will call out sellers, now BB125 will act as resistance. |
| johnpaulca 12,036 posts msg #129273 - Ignore johnpaulca |
6/21/2016 9:45:58 AM Here we have two bands very close together, one acting as support(bb40) and the other as resis(125). The big question which direction to trade. Daily is in pullback mode, price is in BB40 moving from top to bottom...decreasing momo. Option 1....short...cycle already old and due for a mean reversion Option 2....wait for buy signal...best bet Option 3...counter trade...risky!! |
| johnpaulca 12,036 posts msg #129274 - Ignore johnpaulca |
6/21/2016 11:09:05 AM Test: long BIB...$38.40 Short BIS...$$43 |
| graftonian 1,089 posts msg #129277 - Ignore graftonian |
6/21/2016 1:26:59 PM Trying to understand this. Is RGL a hold at this time period? |
| johnpaulca 12,036 posts msg #129278 - Ignore johnpaulca |
6/21/2016 1:28:53 PM RGL??? |
| karennma 8,057 posts msg #129280 - Ignore karennma |
6/21/2016 1:34:38 PM I think he meant RGLD. |
| johnpaulca 12,036 posts msg #129281 - Ignore johnpaulca |
6/21/2016 1:44:42 PM RGLD....is oversold...turning point +168, -168 as mentioned before, I trade pullbacks to the mean once a trend is established. |
| StockFetcher Forums · Stock Picks and Trading · Intraday Alerts | << 1 ... 1511 1512 1513 1514 1515 ... 1903 >>Post Follow-up |