| StockFetcher Forums · Stock Picks and Trading · Mactheriverrat predictions. | << 1 ... 10 11 12 13 14 ... 18 >>Post Follow-up |
| Mactheriverrat 3,178 posts msg #126580 - Ignore Mactheriverrat modified |
1/4/2016 4:25:01 PM Thanks I'm surprised PEIX and ARP held what they did. UVXY- ;-) To me to today is a very good day to run a filter with ----------------------------------- Market is ETF and ema(5) is above ema(5) one day ago Draw EMA(5) Draw EMA(10) draw Macd (1,10,16) draw Macd (2,10,16) draw Macd (3,10,16) and average day range(30) is above 1.00 HxH is number of consecutive days ema(5) above (+)/below(-) previous EMA(5) and set{hhb,days( ema(5) is above EMA(5)1 day ago,100)} set{HHa,days( ema(5) is below EMA(5) 1 day ago,100)} set{HxH, HHa - HHb} and add column HxH {H_x_H} do not draw HxH --------------------------------- Study each Macd fast and slow line of each macd and how it plays out in past sell off markets and how the EMA (5) plays against the EMA(10). Make a symlist of of all the good ETF plays the last 3 days. THEN STUDY To me run it once a day. When the markets get hammered one can smile by the good ETF catch's while the CNBC talking heads have the sky is falling. Just saying! |
| karennma 8,057 posts msg #126612 - Ignore karennma |
1/6/2016 7:05:04 AM Mactheriverrat 604 posts msg #124221 - Ignore Mactheriverrat 6/29/2015 3:18:51 PM Both DWTI and SCO bollinger bands breaking to the up side today Spot WTIC oil is at the lower bollinger band starting to break lower ============== @ Mac, By chance, did you buy DWTI and stay in it? I know you're very modest and would never brag about it, that's Y I'm asking. |
| Mactheriverrat 3,178 posts msg #126627 - Ignore Mactheriverrat modified |
1/6/2016 4:14:07 PM No I didn't have any position in DWTI The chart looks really good. A good start when price closed ( A BULLISH CANDLE) above the EMA(10) 2 days ago. Yesterdays gap up sure was a buyers sign. Today its up some 14% DWTI and SCO have been good plays since oil has fallen from record highs. I didn't see it as the filter I have been using had "Market is not ETF" in it. My Bad. |
| Mactheriverrat 3,178 posts msg #126630 - Ignore Mactheriverrat |
1/7/2016 2:57:49 AM ARCO and MITK - on watch Could be another big sell off day. 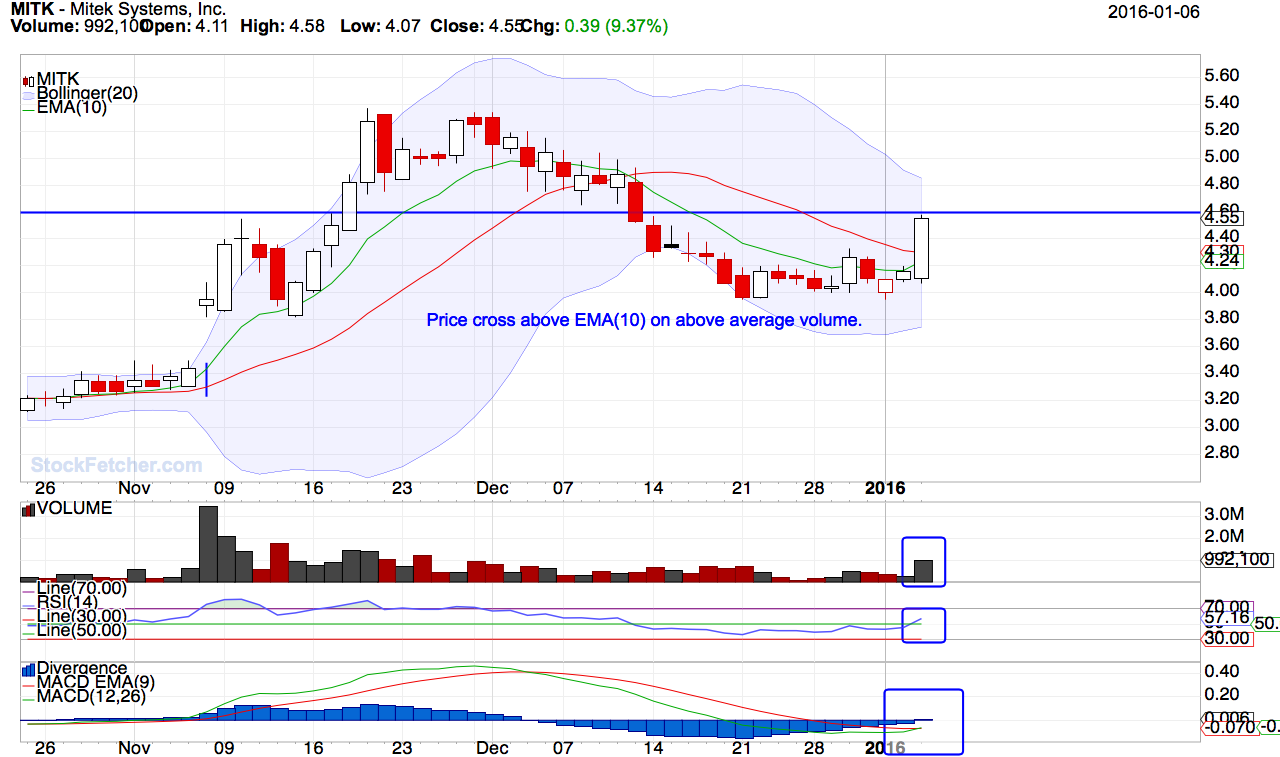 |
| Mactheriverrat 3,178 posts msg #126671 - Ignore Mactheriverrat |
1/10/2016 6:56:07 AM HART 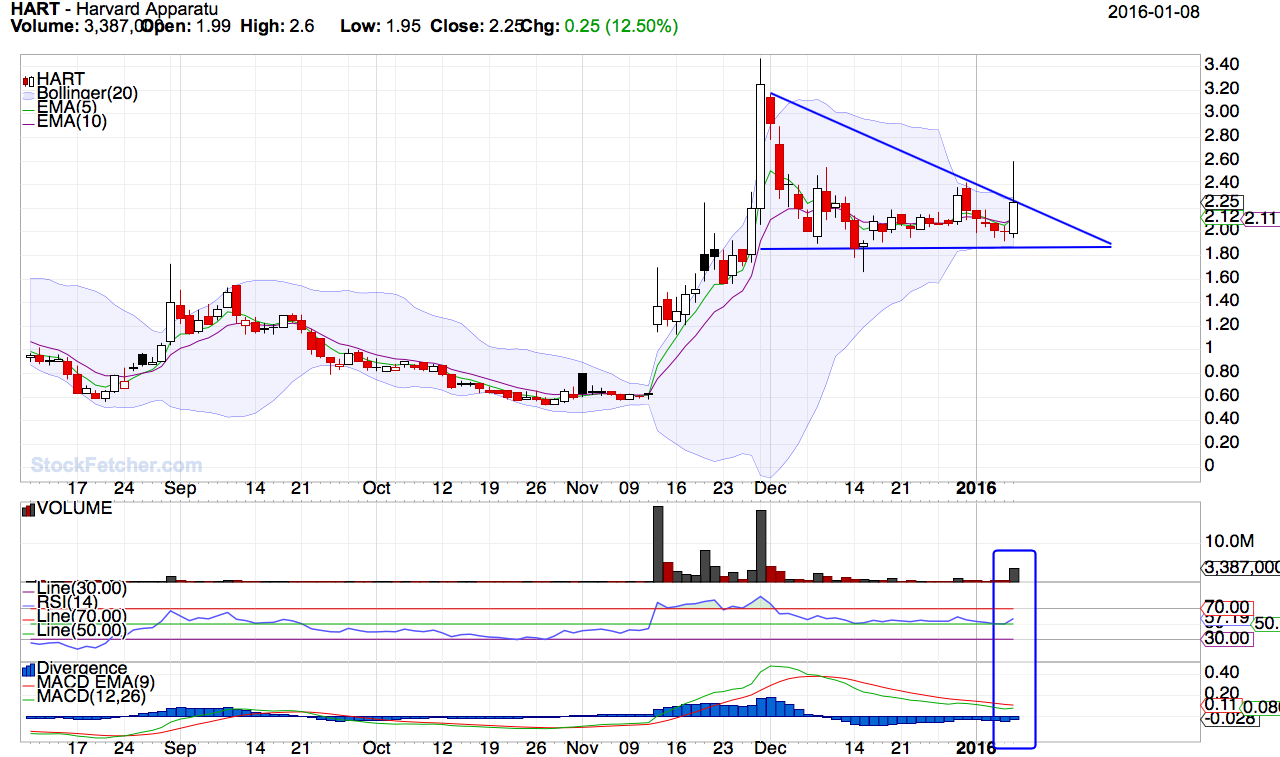 |
| Mactheriverrat 3,178 posts msg #126777 - Ignore Mactheriverrat |
1/16/2016 2:58:37 AM DGLY Downtrend resistance crossed - Good setup for 1-18-2016 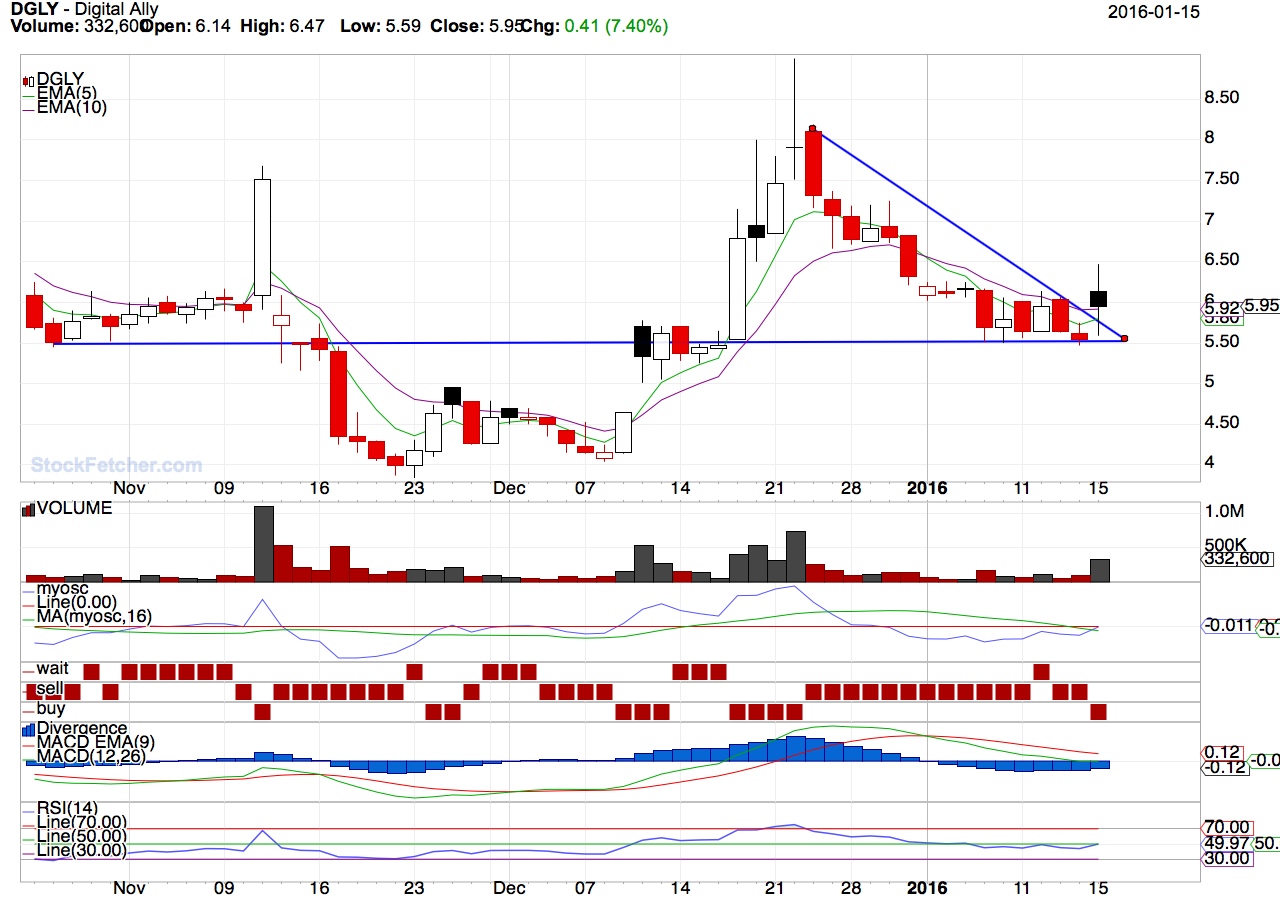 |
| karennma 8,057 posts msg #126778 - Ignore karennma |
1/16/2016 7:40:30 AM HI Mac, I'm sorry to be a pain in the @$$, because I know I've asked you this before ... Anyway, I love that "buy, sell, wait" graph on the bottom of your charts. Would you mind posting the filter that gives you that graph? Thanks. |
| Mactheriverrat 3,178 posts msg #126880 - Ignore Mactheriverrat modified |
1/24/2016 4:24:21 PM YINN - turns Bullish YANG - turns Bearish. move's to the 20 MA. IMHO. |
| Mactheriverrat 3,178 posts msg #126881 - Ignore Mactheriverrat modified |
1/24/2016 7:17:40 PM @karennma The code was from from a filter that Kevin_in_GA posted in the past. et{pp_3, CMA(pp,3) 1 day ago} set{r_3, CMA(r1,3) 1 day ago} set{s_3, CMA(s1,3) 1 day ago} set{VAR1, count(close above pp_3,1)} set{VAR2, count(close below r_3,1)} set{WAIT, VAR1 * VAR2} set{BUY, var1 - wait} set{SELL, var2 - wait} draw WAIT draw SELL draw BUY add column BUY add column SELL add column WAIT add column pp_3 add column r_3 add column s_3 |
| karennma 8,057 posts msg #126882 - Ignore karennma |
1/24/2016 7:45:27 PM Mactheriverrat 620 posts msg #126880 - Ignore Mactheriverrat modified 1/24/2016 4:24:21 PM YINN - turns Bullish YANG - turns Bearish. move's to the 20 MA. IMHO. ========== Good! I hope YANG goes to $99. |
| StockFetcher Forums · Stock Picks and Trading · Mactheriverrat predictions. | << 1 ... 10 11 12 13 14 ... 18 >>Post Follow-up |